How to Read Crypto Charts Like a Pro
Understanding how to read crypto charts is essential for anyone looking to navigate the volatile world of cryptocurrency trading. Whether you are a seasoned trader or a newcomer, mastering chart analysis can significantly enhance your trading strategy and decision-making process. This comprehensive guide will delve into the various aspects of crypto charts, including types of charts, key indicators, and practical tips to help you interpret market movements effectively.
Understanding Crypto Charts
Crypto charts are visual representations of price movements over time. They provide traders with insights into market trends, potential reversals, and overall sentiment. The primary types of charts used in cryptocurrency trading include:
- Line Charts: These charts connect closing prices over a specified period, providing a simple view of price trends.
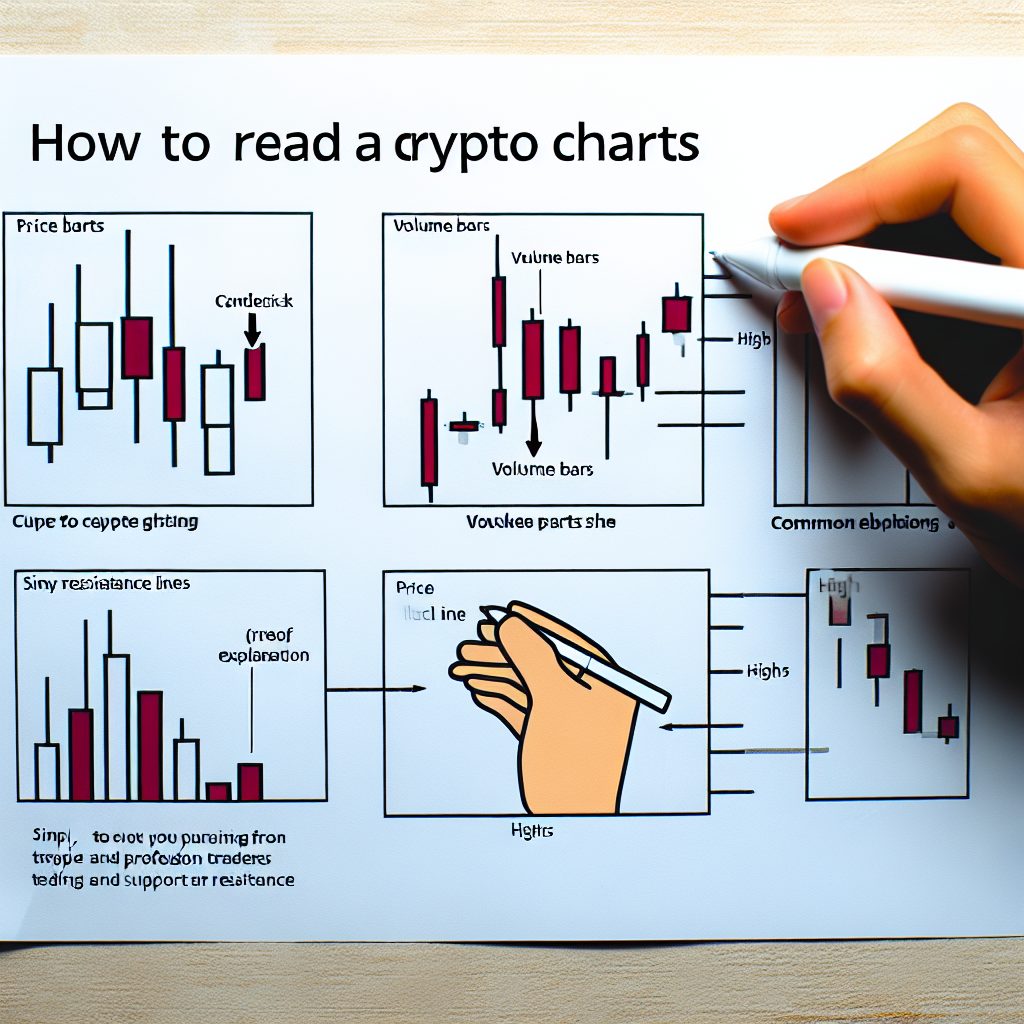
- Candlestick Charts: These charts display the open, high, low, and close prices for a specific time frame, offering more detailed information about price movements.
- Bar Charts: Similar to candlestick charts, bar charts show the open, high, low, and close prices but use vertical lines to represent price ranges.
Among these, candlestick charts are the most popular in the crypto community due to their ability to convey more information in a compact format.
Key Components of Candlestick Charts
Candlestick charts consist of individual candles that represent price movements over a specific time frame. Each candle has four key components:
- Open: The price at which the asset started trading during the time frame.
- Close: The price at which the asset finished trading during the time frame.
- High: The highest price reached during the time frame.
- Low: The lowest price reached during the time frame.
The body of the candle is colored based on whether the closing price is higher or lower than the opening price. A green (or white) candle indicates a price increase, while a red (or black) candle indicates a price decrease.
Time Frames in Crypto Trading
Choosing the right time frame is crucial for effective chart analysis. Different traders prefer different time frames based on their trading strategies:

- Scalpers: Traders who make quick trades within minutes or seconds often use 1-minute or 5-minute charts.
- Day Traders: These traders typically analyze 15-minute to 1-hour charts to make trades within a single day.
- Swing Traders: Traders who hold positions for several days or weeks often use daily or weekly charts.
- Long-term Investors: Those looking to hold assets for months or years may focus on weekly or monthly charts.
Understanding the time frame that aligns with your trading style is essential for effective analysis.
Key Indicators for Crypto Chart Analysis
To read crypto charts like a pro, you need to familiarize yourself with various technical indicators that can help you make informed decisions. Here are some of the most commonly used indicators:
1. Moving Averages
Moving averages smooth out price data to identify trends over a specific period. The two most common types are:
- Simple Moving Average (SMA): This is calculated by averaging the closing prices over a specified number of periods.
- Exponential Moving Average (EMA): This gives more weight to recent prices, making it more responsive to new information.
Traders often use moving averages to identify support and resistance levels and to spot potential trend reversals.
2. Relative Strength Index (RSI)
The RSI is a momentum oscillator that measures the speed and change of price movements. It ranges from 0 to 100 and is typically used to identify overbought or oversold conditions:
- RSI above 70 indicates that an asset may be overbought.
- RSI below 30 suggests that an asset may be oversold.
Traders often look for divergences between the RSI and price movements to spot potential reversals.
3. Moving Average Convergence Divergence (MACD)
The MACD is a trend-following momentum indicator that shows the relationship between two moving averages of an asset’s price. It consists of:
- MACD Line: The difference between the 12-day EMA and the 26-day EMA.
- Signal Line: The 9-day EMA of the MACD line.
Traders look for crossovers between the MACD line and the signal line to identify potential buy or sell signals.
4. Bollinger Bands
Bollinger Bands consist of a middle band (SMA) and two outer bands that represent standard deviations from the SMA. They help traders identify volatility and potential price reversals:
- When the price touches the upper band, it may indicate overbought conditions.
- When the price touches the lower band, it may indicate oversold conditions.
Chart Patterns to Watch For
In addition to indicators, recognizing chart patterns can provide valuable insights into potential price movements. Here are some common patterns:
1. Head and Shoulders
This pattern indicates a potential reversal in trend. It consists of three peaks: a higher peak (head) between two lower peaks (shoulders). An inverse head and shoulders pattern indicates a potential bullish reversal.
2. Double Top and Double Bottom
A double top pattern occurs after an uptrend and indicates a potential bearish reversal, while a double bottom pattern occurs after a downtrend and suggests a potential bullish reversal.
3. Flags and Pennants
These continuation patterns indicate a brief consolidation before the previous trend resumes. Flags are rectangular-shaped, while pennants are triangular.
Practical Tips for Reading Crypto Charts
To effectively read crypto charts, consider the following practical tips:
- Combine Indicators: Use multiple indicators to confirm signals and reduce false positives.
- Stay Updated: Keep an eye on news and events that may impact the cryptocurrency market.
- Practice Patience: Avoid making impulsive decisions based on short-term price movements.
- Use Stop-Loss Orders: Protect your investments by setting stop-loss orders to limit potential losses.
Case Studies: Successful Chart Analysis
Examining real-world examples can provide valuable insights into effective chart analysis. Here are two notable case studies:
Case Study 1: Bitcoin’s Bull Run in 2020
During the bull run of 2020, Bitcoin’s price surged from around $7,000 in September to over $40,000 by December. Traders who utilized moving averages and RSI effectively identified key entry points. For instance, the crossover of the 50-day EMA above the 200-day EMA (a golden cross) signaled a strong bullish trend, prompting many traders to enter positions.
Case Study 2: Ethereum’s Market Correction in 2021
In May 2021, Ethereum experienced a significant correction after reaching an all-time high of over $4,300. Traders who monitored the RSI noticed it was approaching overbought territory, indicating a potential reversal. As the price began to decline, those who had set stop-loss orders were able to minimize their losses effectively.
Frequently Asked Questions (FAQs)
What is the best chart type for beginners?
The candlestick chart is often recommended for beginners due to its ability to convey detailed information about price movements in a visually appealing format.
How can I practice reading crypto charts?
Many trading platforms offer demo accounts where you can practice reading charts without risking real money. Additionally, you can use historical data to analyze past price movements and test your skills.
What are the most important indicators for crypto trading?
While there are many indicators available, moving averages, RSI, and MACD are among the most widely used and effective for identifying trends and potential reversals.
How do I know when to buy or sell?
Look for confirmation signals from multiple indicators and patterns. For example, a bullish crossover in the MACD combined with an RSI below 30 may indicate a good buying opportunity.
Conclusion
Reading crypto charts like a pro requires a combination of knowledge, practice, and patience. By understanding the different types of charts, key indicators, and patterns, you can enhance your trading strategy and make more informed decisions. Remember to stay updated on market news and continuously refine your skills. With dedication and practice, you can navigate the cryptocurrency market with confidence and success.
For further reading and resources, consider visiting trusted sources such as CoinDesk and CoinTelegraph.
The Crypto Watchlist of the Week 🔎
Subscribe to receive expert-curated projects with real potential—plus trends, risks, and insights that matter. Get handpicked crypto projects, deep analysis & market updates delivered to you.


